Technical Reference
ARGOS Documentation
Complete technical reference for the Adaptive Real-time Geopolitical Operating System (ARGOS), covering all 104 input variables, 22 computational models + AI Signal Layer, 7 sub-indices, and the GRS/GRS-Live aggregation methodology. Developed as part of The Calculus of Nations.
1. Framework Overview
The Adaptive Real-time Geopolitical Operating System (ARGOS) is a multi-layered computational framework designed to quantify geopolitical risk at the nation-state level. Developed as the analytical engine behind The Calculus of Nations, ARGOS synthesizes 104 input variables from 35 sources (28 baseline statistical databases plus 7 real-time OSINT feeds) through 22 statistical and machine learning models arranged across 7 computational layers + AI Signal Layer. The AI Signal Layer ingests real-time OSINT from multiple sources (NewsAPI.ai, GDELT, UCDP, ReliefWeb, HDX, ICG CrisisWatch (ACLED pending), and international wire services), categorizes events via Forge LLM, and produces GRS-Live.
The framework produces two composite metrics: GRS-Baseline (the static Layers 1–7 output) and GRS-Live (the dynamic score incorporating AI Signal Layer adjustments), for each of 87 nations. The GRS is computed as a weighted linear combination of seven sub-indices, each capturing a distinct dimension of geopolitical risk: internal stability (ISI), external threats (ETI), economic vulnerability (EVI), cascade exposure (CEI), and adaptive capacity (ACI), environmental stress (ENV), and supply-chain fragility (SCI). The final integration uses 100,000 Monte Carlo iterations per country to produce a probability distribution, capturing the inherent uncertainty in geopolitical forecasting. GRS-Live then adjusts this baseline with time-decaying AI signals from categorized news events.
Architecture Summary
Structural
M1-M9
Time Series
M10-M12
Strategic
M13-M14
Cascade
M15-M16
Demographic
M17-M19
Economic
M20-M21
Integration
M22
AI Signal
Multi-Source+LLM
The full layered GRS formula is:
where GRSbaseline = 0.25 × ISI + 0.25 × ETI + 0.20 × EVI + 0.15 × CEI - 0.15 × ACI
λ1=0.55, λ2=0.10, λ3=0.10, λ4=0.15, λ5=0.10 (sum = 1.00)
Weight Rationale & Limitations
Lambda weights were calibrated via cross-validated ridge regression against the 47-event validation set. They are transparent analytic assumptions, not yet validated by full out-of-sample optimization. Future releases will incorporate prospective error analysis to refine weight allocation. The full layered GRS composite is bounded in [-8.25, +93.25] (Theorem 10, machine-verified, Lean 4).
The GRS-Live formula adds AI signal adjustments:
where Signali = Σ(magj × confj × e-λ(t-tj)) / Neff, half-life = 7 days
Score Range & Interpretation
The theoretical GRS range is [-15, +85], not [0, 100]. The positive weights (ISI, ETI, EVI, CEI) sum to 0.85, while the negative ACI weight (-0.15) means countries with very high adaptive capacity and low risk factors can producenegative GRS values. A negative GRS indicates that a nation's institutional resilience (ACI) more than offsets its aggregate risk exposure, a desirable outcome reflecting strong governance, economic diversification, and social cohesion.
For example, Norway (GRS = -0.5) and Switzerland (GRS = 6.3) have very low scores because their very high ACI (95) substantially reduces their composite risk below zero. The net algebraic sum of all weights is 0.70, not 1.0, which is a deliberate design choice: the ACI discount factor ensures that adaptive capacity provides meaningful risk reduction rather than merely offsetting one sub-index.
Countries are assigned to five risk tiers based on their GRS: Low (GRS < 15), Moderate (15-30), Elevated (30-45), High (45-60), and Critical (GRS > 60). The negative weight on ACI reflects its role as a mitigating factor: nations with strong institutions, governance, and human capital see their overall risk score reduced.
Mathematical Bounds (Machine-Verified)
The GRS-Baseline formula above is bounded in [-15, +85] (Theorems 3a-3b, Lean 4). The full layered GRS composite output, incorporating signal layers, ENV, and SCI, is bounded in [-8.25, +93.25] (Theorem 10, Lean 4). Both bounds are machine-checked at /formal-verification.
2. Data Pipeline
The ARGOS pipeline transforms raw data from 35 sources (28 baseline databases + 7 OSINT feeds) through 10 sequential stages, from initial ingestion to final GRS output. Each stage is described below with its inputs, outputs, and representative operations.
Stage 1: Data Ingestion
35 sources (28+7) → 104 base variables (340 in full specification)Raw data collection from 28 baseline databases (35 total sources including 7 OSINT feeds)
Operations
- •104 base variables per country (340 in the full specification including derived features)
- •87 countries assessed
- •35 total sources (28 baseline databases + 7 OSINT feeds)
- •Annual refresh cycle
- •Automated API pipelines
Examples
- •World Bank API → GDP, trade, demographics
- •V-Dem → 45 democracy indicators
- •SIPRI → military expenditure, arms transfers
- •UCDP → conflict events, battle deaths
- •UNHCR → refugee populations, IDPs
- •FAO AQUASTAT → water stress, withdrawals
- •ND-GAIN → climate vulnerability
- •USGS → critical mineral dependency
- •IEA → energy import concentration
Stage 2: Normalization & Imputation
104 base variables → 104 normalized base variablesData cleaning, standardization, and missing value imputation
Operations
- •Z-score normalization
- •Min-max scaling to [0,100]
- •Multiple imputation (MICE)
- •Temporal interpolation
- •Outlier detection (IQR)
Examples
- •GDP per capita → z-score normalized across 87 countries
- •Missing Gini values → MICE imputation from correlated indicators
- •Polity V (-10 to +10) → rescaled to [0,100]
- •Battle deaths outliers → Winsorized at 99th percentile
Stage 3: Layer 1: Structural Estimation
~280 variables → ISI, ETI, ACI base scores9 models (M1-M9): Classical ML and statistical estimation
Operations
- •M1: Logistic Regression → conflict onset probability
- •M2: Ridge Regression → continuous forecasting
- •M3: Decision Trees → risk regime classification
- •M4: Random Forest → ACI computation (500 trees)
- •M5: XGBoost → primary predictor (60+ variables)
- •M6: SVM → deterrence boundary detection
- •M7: KNN → historical analogy (K=10)
- •M8: K-Means → country typologies
- •M9: Neural Network → NLP/OSINT processing
Examples
- •M1 ingests 28 variables → outputs P(conflict) = 0.42 for Tunisia 2010
- •M4 processes 35 governance indicators → ACI = 88 for Germany
- •M5 uses 60+ variables → ETI = 55 for Russia pre-2022
Stage 4: Layer 2: Time Series Forecasting
~30 time series → EVI, ISI temporal adjustments3 models (M10-M12): Temporal dynamics and trend projection
Operations
- •M10: ARIMA → GDP, military spending, population forecasts
- •M11: VAR → multi-variable interdependency
- •M12: Prophet → seasonal/cyclical decomposition
Examples
- •M10: ARIMA(2,1,1) forecasts Russia GDP contraction of -8.2% under sanctions
- •M11: VAR captures feedback loop between military spending and GDP growth
- •M12: Prophet detects seasonal protest cycles in Egypt (anniversary effects)
Stage 5: Layer 3: Strategic Interaction
~32 strategic variables → ISI, ETI strategic adjustments2 models (M13-M14): Decision-theoretic modeling and agent-based dynamics
Operations
- •M13: BDM Selectorate → leader survival, diversionary war
- •M14: ABM → multi-actor emergent dynamics (10,000 iterations)
Examples
- •M13: Putin W/S ratio declining → illustrative diversionary conflict probability estimate (not a calibrated forecast)
- •M14: ABM simulates NATO Article 5 cascade → 10,000 scenario iterations
- •M13: Xi Jinping selectorate analysis → illustrative Taiwan escalation risk estimate
Stage 6: Layer 4: Cascade Propagation
~37 network variables → CEI scores, contagion multipliers2 models (M15-M16): Spatial and network contagion
Operations
- •M15: SAR → geographic contagion (rho = 0.35)
- •M16: Four-Layer Network → information, economic, alliance, civilizational cascades
Examples
- •M15: Ukraine conflict → SAR back-test indicates Moldova contagion risk = 0.72
- •M16: Tunisia → Egypt cascade via information network (28-day lag from Ben Ali departure to Mubarak resignation, back-test observation)
- •M16: Russia sanctions → economic network cascade multiplier = 2.5x
Stage 7: Layer 5: Demographic & Social
~64 demographic/social variables → ISI, ACI demographic adjustments3 models (M17-M19): Population dynamics and social modeling
Operations
- •M17: Bayesian Hierarchical → demographic projections
- •M18: Cohort-Component → population forecasts with migration
- •M19: SEM → Democratic Resilience Index (14 indicators)
Examples
- •M17: Niger youth bulge (47% under 15) → ISI demographic pressure = High
- •M18: Syria refugee outflow → 7.7M projected displacement
- •M19: 14-indicator Democratic Resilience Index → ACI = 12 for North Korea
Stage 8: Layer 6: Economic Modeling
~36 economic variables → EVI scores, trade impact estimates2 models (M20-M21): Macroeconomic and trade modeling
Operations
- •M20: SDMP (DSGE-Inspired) → macroeconomic projection, sanctions impact
- •M21: Gravity Model → bilateral trade, sanctions effects
Examples
- •M20: SDMP estimates Argentina inflation trajectory under IMF program
- •M21: Gravity model estimates 65% trade reduction under full sanctions
- •M20: Simplified Taylor rule simulation → fiscal sustainability risk for Italy
Stage 9: Layer 7: Integration & Monte Carlo
All Layer 1-6 outputs + ENV + SCI → GRS per country1 model (M22): Final aggregation via 100,000 Monte Carlo iterations
Operations
- •M22: Monte Carlo → GRS probability distribution
- •Convergence: SE(p=0.5) ≈ 0.0016
- •Layered GRS: λ₁·GRS_baseline + λ₂·GRS_signal + λ₃·SCV + λ₄·ENV + λ₅·SCI
- •GRS_baseline = 0.25×ISI + 0.25×ETI + 0.20×EVI + 0.15×CEI − 0.15×ACI
Examples
- •100,000 iterations → GRS = 62.4 ± 3.2 for Syria (Critical)
- •GRS distribution: mean = 19.7, 5th percentile = 8.2, 95th = 44.1 (global)
- •Confidence interval narrows with each additional data source
Stage 10: AI Signal Layer
Multi-source OSINT + V2Tone → 7 AI signals + sentiment per countryReal-time multi-source OSINT ingestion (NewsAPI.ai, GDELT, ACLED, UCDP, ReliefWeb, HDX, ICG CrisisWatch, RSS), LLM classification via Forge, time-decaying AI signal generation, and GDELT V2Tone sentiment-to-CEI wiring (v2.1)
Operations
- •Multi-source OSINT: NewsAPI.ai, GDELT, ACLED, UCDP, ReliefWeb, HDX, ICG CrisisWatch, 13+ RSS wire services
- •Forge LLM: structured sub-index classification with confidence
- •Time-decay weighting: half-life = 7 days (exponential)
- •Signal_i = Σ(mag_j × conf_j × decay(t)) / N_eff
- •Produces 7 AI adjustment signals: ISI-AI, ETI-AI, EVI-AI, CEI-AI, ACI-AI, ENV-AI, SCI-AI
- •V2Tone sentiment → CEI blend: CEI_blended = 0.90 × CEI_OSINT + 0.10 × sentiment_risk (v2.1)
- •Sentiment anomaly detection: z-score < -2.0 vs 30-day baseline → owner alert
Examples
- •Multi-source pipeline ingests 50+ articles/day per country → LLM classifies each to sub-index
- •Russia sanctions news → EVI-AI = +1.8, CEI-AI = +0.9 (risk-amplifying)
- •Japan economic reform → EVI-AI = -0.5, ACI-AI = -0.3 (risk-reducing)
- •GDELT V2Tone = -4.2 for Syria → sentiment_risk = +0.42 → CEI blended upward
- •Ukraine tone drops 2.8σ below 30-day mean → anomaly alert triggered
Stage 11: GRS-Live Output & Classification
GRS + AI signals → 85 country scores + tiers + live deltasFinal GRS-Live score combining Layers 1–7 baseline with AI Signal Layer adjustments, plus tier classification and confidence intervals
Operations
- •GRS-Live = GRS-Baseline + AI Delta
- •AI Delta = Σ(w_i × Signal_i)
- •Low: GRS < 15
- •Moderate: 15-30
- •Elevated: 30-45
- •High: 45-60
- •Critical: GRS > 60
Examples
- •USA: GRS = 9.5 (Low), AI Delta → GRS-Live adjustment
- •Russia: GRS = 38.5 (Elevated), AI Delta → GRS-Live adjustment
- •Somalia: GRS = 59.3 (High), AI Delta → GRS-Live adjustment
Stage 12: GRS-z: Geopolitical Redshift Index
All 85 country GRS scores + alliance data + UNGA votes + CINC → Single systemic index [0, 1]Systemic-level index measuring the structural shift from unipolarity toward multipolarity. Analogous to cosmological redshift, GRS-z quantifies alliance entropy, capability concentration, voting divergence, and diplomatic dispersion across the entire international system.
Operations
- •GRS-z = f(H, C, V, D) — four-component systemic index
- •H = Alliance Network Entropy (Shannon entropy of alliance adjacency matrix)
- •C = Capability Concentration (1 − HHI of CINC scores)
- •V = Voting Divergence (mean pairwise UNGA ideal-point distance)
- •D = Diplomatic Dispersion (normalized count of active bilateral channels)
- •Multipolar threshold: GRS-z ≥ 0.50
- •Current reading: GRS-z = 0.52 (post-Iran War 2026)
- •Secular trend: +0.013/year with oscillation (redshift/blueshift cycles)
Examples
- •Cold War peak (1962): GRS-z = 0.38 (bipolar, low entropy)
- •Post-USSR collapse (1992): GRS-z = 0.22 (unipolar minimum)
- •Post-Iran War (2026): GRS-z = 0.52 (multipolar threshold breached)
- •Fragmented Multipolarity scenario (2035): GRS-z projected 0.65-0.70
3. Data Sources
ARGOS draws from 35 sources: 28 baseline statistical databases providing structured indicators, plus 7 real-time OSINT and intelligence feeds powering the AI Signal Layer. Each source is selected for its methodological rigor, temporal coverage, and cross-national comparability.
Reading the "Variables" column: Each source lists the number of indicators it contributes to the ARGOS pipeline. Because some indicators appear in multiple sources (e.g., GDP data from both World Bank and IMF), the per-source column sums to 435, which exceeds the 104 deduplicated base variables. See the table footer for the three-level reconciliation: source-level total, deduplicated base variables, and expanded model features.
| # | Source | Full Name | Type | Variables | Coverage |
|---|---|---|---|---|---|
| 1 | World Bank | World Bank Open Data | economic | 62 | GDP, trade, debt, demographics, infrastructure, and development indicators |
| 2 | IMF | International Monetary Fund WEO | economic | 28 | Macroeconomic forecasts, fiscal balances, current account, exchange rates |
| 3 | V-Dem | Varieties of Democracy Institute | political | 45 | Liberal democracy, electoral integrity, civil liberties, judicial independence, media freedom |
| 4 | SIPRI | Stockholm International Peace Research Institute | military | 22 | Military expenditure, arms transfers, nuclear forces, peacekeeping |
| 5 | UCDP | Uppsala Conflict Data Program | conflict | 18 | Armed conflict events, battle deaths, non-state violence, one-sided violence |
| 6 | ACLED | Armed Conflict Location & Event Data | conflict | 15 | Political violence events, protests, riots, strategic developments |
| 7 | Freedom House | Freedom House | governance | 12 | Political rights, civil liberties, internet freedom, nations in transit |
| 8 | Transparency Intl. | Transparency International | governance | 8 | Corruption Perceptions Index, bribery risk, government defense integrity |
| 9 | Fund for Peace | Fund for Peace | governance | 12 | Fragile States Index (12 indicators: cohesion, economic, political, social) |
| 10 | Polity V | Center for Systemic Peace - Polity5 | political | 8 | Regime type, executive constraints, political competition, regime durability |
| 11 | UN Population | UN Population Division | demographic | 35 | Population projections, age structure, fertility, mortality, migration |
| 12 | UNHCR | UN Refugee Agency | social | 10 | Refugee populations, internally displaced persons, asylum seekers, stateless persons |
| 13 | RSF | Reporters Without Borders | governance | 6 | Press Freedom Index, journalist safety, media independence, legal framework |
| 14 | IISS | International Institute for Strategic Studies | military | 18 | Military Balance: force structure, equipment, defense budgets, deployments |
| 15 | UNCTAD | UN Conference on Trade and Development | economic | 14 | FDI flows, trade matrices, commodity prices, investment policy |
| 16 | FAS/SIPRI Nuclear | Federation of American Scientists | military | 5 | Nuclear warhead inventories, delivery systems, fissile material stocks |
| 17 | Alesina et al. | Fractionalization Dataset (Alesina et al. 2003) | social | 6 | Ethnic, linguistic, and religious fractionalization indices |
| 18 | WTO | World Trade Organization | economic | 12 | Bilateral trade flows, tariff schedules, trade disputes, services trade |
| 19 | ILO | International Labour Organization | social | 16 | Labor force participation, youth unemployment, informal employment, working poverty |
| 20 | WHO | World Health Organization | demographic | 8 | Health expenditure, disease burden, health system capacity, pandemic preparedness |
| 21 | FAO AQUASTAT | FAO AQUASTAT Water Database | environmental | 8 | Water stress ratio, renewable water resources, water withdrawals, irrigation dependency |
| 22 | ND-GAIN | Notre Dame Global Adaptation Initiative | environmental | 12 | Climate vulnerability index, readiness score, food/water/health/ecosystem sensitivity |
| 23 | EM-DAT | Emergency Events Database (CRED) | environmental | 6 | Natural disaster frequency, mortality, economic damage, affected population |
| 24 | NASA GRACE | NASA GRACE Satellite Groundwater | environmental | 4 | Groundwater depletion rates, aquifer stress, terrestrial water storage anomalies |
| 25 | USGS | US Geological Survey Mineral Commodities | supply_chain | 15 | Critical mineral production, reserves, import dependency, supplier concentration |
| 26 | IEA Critical Minerals | IEA Critical Minerals Report | supply_chain | 10 | Energy transition mineral demand, supply concentration, recycling rates |
| 27 | UN Comtrade | UN Comtrade Database | supply_chain | 12 | Bilateral trade flows for critical materials, semiconductor components, energy commodities |
| 28 | OECD I-O Tables | OECD Inter-Country Input-Output Tables | supply_chain | 8 | Cross-border value chain dependencies, intermediate goods trade, sectoral exposure |
| 29 | NewsAPI.ai | NewsAPI.ai (Event Registry) | intelligence | 0 | Real-time global news aggregation across 150,000+ sources in 40+ languages, powering the AI Signal Layer |
| 30 | GDELT | GDELT Project (OSINT Feed) | intelligence | 0 | Real-time global event monitoring in 65+ languages, primary OSINT feed for AI Signal Layer |
| 31 | ReliefWeb | ReliefWeb (UN OCHA) | intelligence | 0 | Humanitarian situation reports, disaster updates, and crisis analyses from UN OCHA |
| 32 | HDX | Humanitarian Data Exchange | intelligence | 0 | Open humanitarian datasets on food security, displacement, and crisis indicators from OCHA |
| 33 | ICG CrisisWatch | International Crisis Group CrisisWatch | intelligence | 0 | Monthly conflict tracker covering escalation, de-escalation, and unchanged situations globally |
| 34 | UCDP | Uppsala Conflict Data Program (GED) | intelligence | 0 | Georeferenced Event Dataset with near-real-time conflict events, fatality estimates, and violence type classification |
| 35 | ACLED | Armed Conflict Location & Event Data (OSINT) | intelligence | 0 | Political violence and protest event data (pending Research-tier API access) |
| Source-Level Total | 435 | Sum of per-source counts (includes overlaps) | |||
| Deduplicated Base Variables | 104 | Unique inputs after cross-source deduplication | |||
| Expanded Model Features | ~340 | After lags, interactions, and engineered features | |||
4. Variable Catalog
The complete catalog of 104 base input variables organized by category. Each variable entry shows its data source, unit of measurement, which models (M1-M22) consume it, and which sub-indices it feeds. Click a category to expand the full variable list.
Note on variable counts: The 104 base variables listed here are the raw inputs collected from external sources. In the full computational specification, these expand to approximately 340 features through model-specific transformations: lagged values (e.g., 1-year and 3-year lags), interaction terms (e.g., GDP growth x inequality), normalized ratios, and engineered features (e.g., rolling volatility, z-scores). The Variable Explorer at /variables displays the 104 base inputs; the per-layer breakdowns elsewhere in this Wiki reflect the expanded feature counts consumed by each model.
5. Model Architecture (M1-M22)
The 22 models are organized across 7 computational layers + AI Signal Layer (Layers 1–7 static + AI Signal Layer), each addressing a distinct analytical dimension. Click any model to expand its full specification, including input variables, outputs, and methodology.
6. Sub-Index Composition
Each of the seven sub-indices aggregates outputs from multiple models and draws on a distinct subset of the 104 input variables. The table below shows the variable composition, contributing models, and weight of each sub-index in the final GRS formula.
Multicollinearity note: Sub-indices are not orthogonal. For example, ISI and ETI share conflict-related variables, and EVI correlates with CEI through trade-exposure channels. The additive weighting formula treats sub-indices as independent contributions, which overstates precision when correlations are high. The Correlation Matrix page visualizes inter-sub-index Pearson coefficients for each nation.
7. GRS Formula & Risk Tiers
The Geopolitical Risk Score is computed as a weighted linear combination of the seven sub-indices. The weights reflect the relative importance of each dimension in determining overall geopolitical risk, as calibrated through retrospective back-testing against known geopolitical events (1990-2024). Note: this calibration has not been validated out-of-sample; the 5 free parameters (weights) were fit to 47 historical events, and overfitting risk should be acknowledged.
GRS Aggregation Formula
Where i denotes the country, and each sub-index is scored on a 0-100 scale. The negative weight on ACI means that higher adaptive capacity reduces the overall risk score. The resulting GRS has a machine-verified range of [-15, +85] (Theorems 3a-3b, Lean 4): the minimum occurs when all risk sub-indices are 0 and ACI is 100, while the maximum occurs when all risk sub-indices are 100 and ACI is 0. Negative GRS values indicate that institutional resilience more than offsets aggregate risk exposure.
The Monte Carlo integration (M22) runs 100,000 iterations per country, sampling from the uncertainty distributions of each model's output. The reported GRS-Baseline is the mean of this distribution, with confidence intervals available for each country.
AI Signal Layer: Enhanced 5-Stage Signal Pipeline
5-Stage Signal Refinement Pipeline:
5 tiers: Reuters/AP (0.95) to unknown (0.35). Modulates effective event weight.
Jaccard trigram similarity > 0.3 within 48h window. Clustered events share a single representative.
Iterative weighted averaging dynamics. Convergence guaranteed under standard row-stochastic conditions (DeGroot, 1974).
Reduces volatility from single-event spikes by blending with previous smoothed value.
Cmax = 5 × avgConfidence (design parameter, not empirically optimized). Prevents low-confidence signals from producing extreme adjustments. The multiplier of 5 was chosen as a conservative bound; sensitivity analysis across [3, 7] showed stable GRS outputs.
The pipeline produces lower-variance signals under the assumption of signal independence (variance reduction factor approximately (1-α)2 when signals are uncorrelated; actual reduction depends on inter-signal covariance) by a factor of approximately (1 - αmean)2. The convergence visualization on the Dashboard and Intelligence pages shows this noise reduction in real-time as scattered OSINT event dots converge to the consensus point.
| Tier | GRS Range | Interpretation | Count | Examples |
|---|---|---|---|---|
| Low | < 15 | Stable governance, strong institutions, low conflict probability. These nations serve as anchors of regional stability. | 18 | United States, Germany, Japan, Australia |
| Moderate | 15 - 30 | Some structural vulnerabilities present but manageable. Risk of escalation under external shocks. | 34 | Brazil, Colombia, France, Malaysia |
| Elevated | 30 - 45 | Significant stress across multiple dimensions. Active monitoring recommended for policy and investment decisions. | 22 | Russia, India, Turkey, Nigeria |
| High | 45 - 60 | Severe geopolitical stress with elevated probability of destabilizing events. Multiple compounding risk factors. | 9 | Pakistan, Iran, Ukraine, Iraq |
| Critical | > 60 | Extreme, compounding risks including active conflict, state fragility, or systemic failure. Highest alert level. | 4 | Afghanistan, Sudan, Syria, Yemen |
Weight Calibration Rationale
The sub-index weights were calibrated through a combination of expert elicitation, historical retrospective back-testing against 47 major geopolitical events (1990-2024), and sensitivity analysis. Caveat: with 5 free parameters fit to 47 events, overfitting risk exists; no held-out test set or rolling backtest has been published. The key design decisions are:
- ISI and ETI receive equal top weight (+25% each) because historical analysis shows that internal instability and external threats are the two strongest predictors of geopolitical crises, with roughly equal explanatory power.
- EVI receives +20% reflecting the significant but secondary role of economic vulnerability. Economic crises often catalyze political instability but rarely cause geopolitical crises independently.
- CEI receives +15% capturing the increasingly important role of contagion and cascade effects in an interconnected world. This weight has increased from earlier calibrations reflecting post-2010 evidence. As of v2.1, CEI incorporates a 10% GDELT V2Tone sentiment signal blend (CEIblended = 0.90 × CEIOSINT + 0.10 × sentimentrisk), reflecting the back-test observation that media tone shifts preceded cascade events by 48-72 hours (not validated out-of-sample).
- ACI receives -15% as the sole mitigating factor. Nations with strong adaptive capacity can absorb shocks that would destabilize weaker states. The negative sign ensures that institutional strength reduces the overall risk score.
8. Variable Explorer
The Variable Explorer is an interactive analytical tool that provides complete transparency into how ARGOS computes the Geopolitical Risk Score for any of the 87 nations in the system. It allows users to trace the flow of data from raw input variables through the 22 computational models, into the 7 sub-indices, and ultimately to the final GRS.
Explorer Capabilities
Country Drill-Down
Select any country to view all 104 variable values, organized by category. Each variable displays its computed value, the data source, and which models and sub-indices it feeds into.
Country Comparison
Compare two countries side-by-side with delta highlighting. The "Top 10 Divergence Drivers" panel identifies which specific variables most differentiate the two nations, enabling precise analytical comparisons.
Data Export
Export the full variable breakdown for any selected country as CSV for spreadsheet analysis, or use the Print/PDF function to generate a formatted report for offline review or inclusion in research documents.
View Modes
The Variable Explorer offers three complementary view modes:
| Mode | Description | Use Case |
|---|---|---|
| Variable Catalog | Browse all 104 variables organized by 7 thematic categories with search and filtering | Finding specific variables, understanding data coverage |
| Model View | Explore variables grouped by the 22 models that consume them, showing input-output relationships | Understanding model dependencies, tracing computation paths |
| Single Variable | Deep-dive into any individual variable, tracing its complete path from source through models to sub-indices | Auditing specific data points, validating computation chains |
Divergence Analysis
When comparing two countries, the Variable Explorer computes the absolute difference for each variable and ranks them to identify the Top 10 Divergence Drivers. This analysis answers the question: "What specific factors most differentiate Country A from Country B?" For example, comparing the United States (GRS: 9.5) with Afghanistan (GRS: 61.4) reveals that the largest divergences occur in governance indicators (Polity V score, corruption perception), conflict metrics (battle deaths, terrorism index), and economic fundamentals (GDP per capita, debt-to-GDP ratio).
9. Platform Features
The ARGOS Geopolitical Risk Engine platform provides a suite of analytical tools designed for researchers, policy analysts, and risk professionals. Each tool is built to expose the full computational transparency of the ARGOS framework.
Dashboard
/Primary analytical interface with GRS-Baseline/GRS-Live toggle, interactive world choropleth, country-level risk profiles with speedometer gauge, sub-index breakdowns, bloc membership, and the GRS-Live Alert Widget showing the top 5 countries with the largest signal shifts plus Sentiment Impact Badges indicating CEI contribution from GDELT media tone. Supports country and bloc selection with real-time exploration.
World Map
/mapFull-page interactive SVG choropleth with GRS-Baseline/GRS-Live toggle and UCDP Conflict Overlay. Click any country to view detailed risk profile, sub-index radar chart, and bloc membership. Regional analysis tab provides aggregate statistics and top-risk rankings per region. The toggleable UCDP overlay renders georeferenced conflict events from the Uppsala Conflict Data Program as scaled circle markers, sized by fatality count and color-coded by violence type.
Risk Correlation
/correlationPearson correlation matrix and force-directed network graph showing risk interdependencies between nations. Includes GRS-Baseline/GRS-Live toggle. Supports 15+ preset country groups (Great Powers, Flashpoints, BRICS+ vs G7, regional blocs) with adjustable edge thresholds. Features zoom, pan, and fullscreen capabilities.
Scenario Engine
/scenariosWhat-If analysis tool with GRS-Baseline/GRS-Live toggle and interactive dials for adjusting sub-index values and observing GRS impact. Includes sensitivity analysis (tornado chart), pre-built geopolitical scenarios (conflict escalation, economic shock, democratic transition), Monte Carlo simulation controls, and a Presets Library tab for saving, loading, and sharing named what-if configurations (e.g., "Taiwan Strait Crisis 2026") that collaborators can load with one click.
Variable Explorer
/variablesComplete transparency tool for all 104 base variables with GRS-Baseline/GRS-Live toggle. Three view modes (catalog, model, single variable), side-by-side country comparison with divergence analysis, and CSV/PDF export for offline analysis.
Risk Alerts
/alertsIntelligence feed with curated editorial analysis mapped to ARGOS sub-indices, plus live multi-source OSINT monitoring (NewsAPI.ai, NewsAPI.ai, GDELT, UCDP, ReliefWeb, HDX, ICG CrisisWatch (ACLED pending), RSS wire services) across 65 languages filtered to English. Articles are automatically categorized by risk domain.
Data Explorer
/dataStatistical analysis tool with GRS-Baseline/GRS-Live toggle. Features a scatter plot correlating any ARGOS variable against GRS scores, a full sortable country register, and interactive data exploration capabilities.
Sensitivity Analysis
/sensitivityIdentifies which sub-index changes most impact a country's GRS score, with GRS-Baseline/GRS-Live toggle. Tornado diagram reveals the most sensitive risk drivers, while the stress test shows the full range of possible GRS outcomes under simultaneous perturbation.
Case Studies
/case-studiesDetailed analytical narratives for select nations demonstrating how ARGOS variables and models explain real-world geopolitical dynamics. Each case study traces the full computation path from raw data to GRS.
About / Methodology
/aboutComplete technical exposition of the ARGOS architecture, including the Firefly Equation Cascade (animated walk-through of all 37 equations with KaTeX rendering, step-through mode, comparison cascade, and PDF export), the AI Signal Layer Cascade (8-stage OSINT-to-GRS-Live pipeline with typewriter headline streaming, source badges, and dark Neural Feed aesthetic), all 22 model specifications with variable mappings, sub-index composition, and the GRS formula.
OSINT Intelligence
/intelligenceDedicated intelligence page with GRS-Baseline/GRS-Live toggle, surfacing all categorized OSINT events from multiple sources (NewsAPI.ai, NewsAPI.ai, GDELT, UCDP, ReliefWeb, HDX, ICG CrisisWatch (ACLED pending), RSS wire services). Displays a signal summary table across all monitored nations, a Signal-Only Countries box for non-GRS-baseline nations (e.g., Libya, Cuba, Belarus), a GRS-Live historical trend chart with multi-country comparative overlays, event distribution by sub-index, and full scheduler status. Supports filtering by sub-index, country, and time range.
Signal Quality Dashboard
/signal-qualityDedicated analytics view for monitoring OSINT signal processing health. Displays source credibility distribution across all ingested events, cluster deduplication rates showing how many raw events collapse into unique clusters, DeGroot convergence step counts per country, noise reduction ratios achieved by the 5-stage pipeline, and multi-source contribution breakdown (GDELT, ReliefWeb, RSS feeds). Includes time-series charts showing signal quality metrics over time for all monitored nations.
ENV & Supply Chain
/env-supply-chainDedicated analytical dashboard for the two structural sub-indices added in v1.1. Four tabs: Composite Heatmap (87 nations ranked by combined ENV+SCI score with color-coded cells and sort options), Environment (water stress rankings from FAO AQUASTAT, climate risk from Germanwatch CRI, ND-GAIN vulnerability, PM2.5 exposure, deforestation rates, groundwater depletion from NASA GRACE, and natural disaster frequency from EM-DAT), Supply Chain (rare earth import dependency from USGS, semiconductor dependency, critical mineral HHI, energy import concentration from IEA, chokepoint exposure from UNCTAD/Lloyd's, and top-3 supplier concentration from UN Comtrade), and Strategic Reserves (inventory buffer days from IEA, strategic reserve adequacy, and supply chain resilience indicators). All 14 ENV/SCI variables are populated with real data from authoritative sources.
Watchlist
/watchlistComprehensive watchlist management with GRS-Baseline/GRS-Live toggle and four tabs: Personal Watchlist (track any ARGOS country), AI Signal Tiers (view and manage the 4-tier scheduler assignments for all 87 nations), Signal-Only Countries (add/remove non-GRS-baseline nations for AI signal tracking), and Email Digest (configure daily or weekly signal change summaries with top-mover counts).
Historical Anomaly Log
/admin/anomaly-logAdmin-only audit trail of all sentiment anomalies detected by the z-score monitoring system. Each entry records country, timestamp, tone value, 30-day mean, standard deviation, z-score, severity (ELEVATED or SEVERE), and resolution status. Supports filtering by country, severity, and resolution status, individual and bulk resolution with notes, and CSV export. Summary statistics show total, unresolved, severe, and recent (24h) anomaly counts.
Source Health Monitoring
/admin/source-healthAdmin-only real-time monitoring dashboard for all OSINT source integrations. Displays interactive uptime charts (30/60/90-day windows), response time tracking, last successful fetch timestamps, and enable/disable controls for each source (NewsAPI.ai, GDELT, UCDP, ReliefWeb, HDX, ICG CrisisWatch (ACLED pending), RSS feeds). Disabled sources are excluded from the scheduler fetch cycle but retain historical data.
What's New Changelog
/whats-newComplete version-dated changelog of every major platform release from v1.0.0 through the current version. Each entry includes version number, release date, type badge (Major, Feature, Improvement, Fix), description, key highlights, and direct links to relevant pages. Accessible from the Reference dropdown in the main navigation.
Admin Onboarding Tour
/admin (sidebar)Interactive 7-step guided walkthrough in the admin panel sidebar covering Dashboard, GRS Data Editor, OSINT Controls, Source Health, Anomaly Log, Analytics, and Admin Docs. Each step provides contextual description, actionable tip, and navigation button. Progress persists in localStorage and the tour can be replayed at any time.
Print as Handbook
/admin/docsPrint-optimized rendering of the Admin Documentation page. Renders all 10 sections simultaneously with A4 page layout, proper page breaks, light theme conversion, CONFIDENTIAL header, and table header repetition across pages. Triggered via the Print as Handbook button in the Admin Docs page header.
Cross-Validation Audit Trail
/audit-trailComprehensive provenance register documenting every data source update applied during ENV/SCI cross-validation. Displays 34 records across 17 countries with before/after values, absolute and percentage deltas, full citations from 4 peer-reviewed sources (USGS MCS 2025, ND-GAIN 2023, WRI Aqueduct 4.0, FAO AQUASTAT 2025), validation dates, analyst notes, and engine version stamps. Features data freshness indicators (Fresh/Aging/Stale badges with progress bars and tooltips showing days since validation, expected refresh cycles, and next-due dates), filtering by category (ENV/SCI), source, change type (UPDATE/CONFIRMED), full-text search, sortable columns, expandable source provenance panels with organization metadata and URLs, and a detailed modal view for each record showing the complete citation and methodology notes. Accessible from the Reference dropdown in the main navigation.
Data Refresh Pipeline
/data-refreshAutomated monitoring dashboard for 5 authoritative data sources feeding ENV/SCI sub-indices. Tracks World Bank Open Data (API-based, quarterly), FAO AQUASTAT (HTTP, semi-annual), USGS Mineral Commodity Summaries (HTTP, annual), ND-GAIN Country Index (HTTP, annual), and WRI Aqueduct Water Risk Atlas (HTTP, annual). Features per-source status cards with check method badges, refresh cycle indicators, last-checked timestamps, next-due countdowns, and affected variable listings. Includes one-click "Run All Checks" for bulk validation, individual source checks, direct links to source release pages, a full check history table with status/details/timestamps, and a methodology section explaining API vs HTTP check approaches. All check results are persisted in the database for audit purposes. Accessible from the Reference dropdown in the main navigation.
Signal Scheduler & Notifications
The ARGOS platform includes a server-side signal refresh scheduler that automatically ingests OSINT from multiple sources (NewsAPI.ai, GDELT, UCDP, ReliefWeb, HDX, ICG CrisisWatch, and RSS wire services; ACLED pending) and categorizes articles via the Forge LLM on a 6-hour cycle. All 87 ARGOS nations are organized into four priority tiers based on their GRS-Baseline:
- Tier 1 (Critical, GRS >60): 5 countries per cycle, full rotation every 1.5 days.
- Tier 2 (High, GRS 45-60): 4 countries per cycle, full rotation every 18 hours.
- Tier 3 (Elevated, GRS 30-45): 3 countries per cycle, full rotation every 18 hours.
- Tier 4 (Moderate/Low, GRS <30): 3 countries per cycle, full rotation every 4 days.
Watchlisted countries are automatically promoted to Tier 1 frequency. When any country's AI signal exceeds a magnitude of 3.0 points (or total signal magnitude exceeds 6.0), the platform sends an owner notification with a detailed signal summary, enabling rapid response to emerging geopolitical events.
Signal-Only Countries
Beyond the 87 nations with full GRS baselines, ARGOS tracks an additional set of signal-only countries that lack complete static data but generate significant regional, bloc-specific, or inter-nation geopolitical signal activity. These include nations like Libya (LBY), Cuba (CUB), Belarus (BLR), Yemen (YEM), Syria (SYR), and others. Signal-only countries are processed in a dedicated scheduler batch, prioritized by a propagation score that reflects their global and regional signal influence. Users can add or remove signal-only countries from the Watchlist page.
Email Digest
The platform supports configurable email digest scheduling (daily, weekly, or off). Each digest summarizes all signal changes since the last report, highlights the top N movers (configurable, default 10), and lists new OSINT events across the watchlist. Digests are sent via the built-in notification system and can be triggered manually from the Watchlist page.
Comparative GRS-Live Overlays
The GRS-Live Historical Trend Chart supports multi-country comparative overlays, allowing analysts to select multiple nations and compare how their AI signals diverge during the same geopolitical events. Three view modes are available: Baseline vs. Live (comparing static GRS with AI-adjusted GRS-Live), AI Delta (showing only the AI signal adjustment over time), and Signal Breakdown (decomposing the AI signal into its seven sub-index components).
Role-Based Access Control (RBAC)
The ARGOS platform implements role-based access control with two roles: Admin and User. The project owner is automatically promoted to Admin on first login. Admin users have full access to all platform features, including scheduler controls, signal-only country management, email digest configuration, and batch trigger operations. Regular users can view all data, dashboards, and intelligence feeds in read-only mode but cannot modify scheduler settings, manage signal-only countries, or trigger manual OSINT batches. Backend routes are protected with adminProcedure middleware, and frontend controls are conditionally disabled based on the user's role.
OSINT Translation
All OSINT events ingested from multiple sources are automatically translated to English during processing. The Forge LLM detects non-English headlines and translates them as part of the categorization pipeline, ensuring that the Intelligence Feed and Dashboard OSINT panels display consistent English-language headlines regardless of the original source language. Source links are preserved for verification against the original article.
GRS-Baseline vs GRS-Live Toggle
A global toggle control is available on every page that displays GRS scores — Dashboard, World Map, Scenario Engine, Correlation Matrix, Compare, Data Explorer, Variable Explorer, Sensitivity Analysis, Intelligence, and Watchlist — allowing analysts to switch between two display modes:
- GRS-Baseline: Displays the static Layers 1–7 computation with no AI signal adjustment. This is the default mode and reflects the deterministic ARGOS model output.
- GRS-Live: Displays GRS-Baseline plus AI Signal Layer adjustments derived from real-time multi-source OSINT analysis. All tier colors, heatmap shading, world map choropleth, comparison charts, and gauge displays update to reflect the AI-adjusted scores.
When GRS-Live mode is active, the toggle button pulses red and all tier classifications (Low, Moderate, Elevated, High, Critical) are recalculated based on the adjusted score. Signal delta indicators appear alongside scores showing the magnitude and direction of the AI adjustment. The toggle state persists across page navigation within a session. Pages that display only editorial content (Risk Alerts) or static documentation (Methodology, Legal, About) do not include the toggle as they contain no dynamic GRS scores.
GRS-Live Alert Widget
A compact situational awareness card on the Dashboard displays the top 5 countries with the largest absolute AI signal shifts. Each entry shows the country flag, name, GRS-Live score (color-coded by tier), and the signal delta with directional indicators (▲ for risk increase, ▼ for risk decrease). Hovering reveals a detailed tooltip with baseline vs. live comparison, sub-index signal breakdown, and OSINT event count. The widget refreshes every 2 minutes and links directly to the full Intelligence feed.
Scenario Presets Library
The Scenario Engine includes a Presets Library tab that enables users to save, load, and share named what-if configurations. Each preset stores the country code, sub-index adjustments (ISI, ETI, EVI, CEI, ACI), the resulting GRS score, and a category tag (conflict, economic, climate, diplomatic, or custom). Presets can be marked as shared, making them visible to all authenticated users, or kept private. Collaborators can load any shared preset with one click to reproduce the exact scenario configuration. The library supports filtering by country and category, and displays creation/update timestamps for audit purposes.
Signal Quality Dashboard
A dedicated analytics view at /signal-quality monitors the health and effectiveness of the OSINT signal processing pipeline. The dashboard displays four primary metric cards: source credibility distribution (average credibility score across all ingested events), cluster deduplication rate (percentage of raw events that collapse into unique clusters), average DeGroot convergence steps (how many iterations the DeGroot Consensus fusion requires to reach a fixed point), and noise reduction ratio (variance reduction achieved by the 5-stage pipeline). Below the summary cards, per-country breakdowns show individual signal quality metrics for each monitored nation, and a multi-source contribution chart displays the relative volume from NewsAPI.ai, GDELT, UCDP, ReliefWeb, HDX, ICG CrisisWatch (ACLED pending), and RSS wire services (Reuters, BBC, Al Jazeera, DW, France24).
Multi-Source OSINT Ingestion
The ARGOS platform ingests OSINT data from multiple high-confidence sources to maximize sample size and improve noise reduction through the DeGroot Consensus signal processor. Sources are organized by type and credibility tier:
- GDELT Project (Tier 1): The Global Database of Events, Language, and Tone monitors news media across 150+ countries in 65 languages. Primary source for event detection, geolocation, and institutional news sentiment via the V2Tone algorithm (validated by the GDELT Project at approximately 90% polarity agreement with Google Cloud NLP, reported r=0.82; Leetaru & Schrodt, 2013; GDELT Blog, 2019). V2Tone sentiment is wired into the CEI sub-index at 10% weight and powers the Sentiment Anomaly Detection system.
- ACLED (Tier 1): The Armed Conflict Location and Event Data Project provides real-time conflict event data including battles, protests, riots, violence against civilians, and strategic developments. Strengthens the ISI (Internal Stability) and ETI (External Threat) sub-indices.
- UCDP / Uppsala Conflict Data (Tier 1): The Uppsala Conflict Data Program from Uppsala University provides georeferenced event data on organized violence worldwide. Academic-grade conflict data with rigorous coding methodology.
- ReliefWeb API (Tier 1): UN OCHA's humanitarian information platform providing disaster, crisis, and humanitarian situation reports. Strengthens CEI (Cascade Exposure) and EVI (Economic Vulnerability) signals.
- ICG CrisisWatch (Tier 1): International Crisis Group's monthly conflict tracker covering deterioration, improvement, and unchanged situations across all monitored countries.
- HDX (Humanitarian Data Exchange) (Tier 1): OCHA's open data platform providing structured datasets on food security, displacement, and humanitarian indicators.
- RSS Wire Services (Tier 1-2): Reuters, BBC World, Al Jazeera, Deutsche Welle, France24, AP News, The Guardian, NPR, CNBC, and Bloomberg RSS feeds provide real-time news coverage across all risk domains.
All sources are processed through the 5-stage DeGroot Consensus signal processor. Multi-source corroboration increases signal confidence, while the Jaccard trigram deduplication stage prevents the same event reported by multiple sources from being double-counted. Additionally, GDELT V2Tone sentiment data is extracted via the DOC 2.0 API and blended into the CEI sub-index at 10% weight, providing a media tone dimension to cascade risk assessment. The Sentiment Anomaly Detection system monitors each country's tone for z-score anomalies (threshold: z < -2.0 against 30-day rolling baseline) and triggers automated owner notifications when potential crisis escalation is detected.
Collaborative Annotation Layer
The platform includes a human-in-the-loop feedback mechanism that allows authenticated analysts to annotate OSINT events with notes, override LLM categorizations (sub-index assignment, magnitude, confidence), and flag events for review. Annotations are stored in the database and can be applied to signal recomputation by an admin. The annotation panel appears on the Intelligence page and supports viewing all annotations per event, with user attribution and timestamps. This creates a feedback loop that improves the LLM categorization pipeline over time by providing ground-truth corrections from domain experts.
Time-Series Forecasting
The ARGOS platform generates 7-day and 30-day GRS projections with 95% confidence intervals using a multi-method ensemble approach. Three forecasting methods are employed:
- Exponential Moving Average (EMA): Weights recent observations more heavily, capturing short-term momentum in GRS-Live movements.
- Linear Regression: Fits a trend line to historical GRS-Live snapshots, projecting the trajectory forward.
- ARIMA Approximation: Combines EMA and regression with residual analysis for improved accuracy when sufficient data is available.
Confidence intervals widen with longer horizons and higher historical volatility, and narrow with more data points. Forecasts are displayed on the Dashboard when GRS-Live mode is active, showing the projected GRS trajectory with shaded confidence bands. The trend direction (rising, falling, stable) is computed from the most recent 5 observations.
Production Data Management
Admins can finalize current GRS-Live data as the canonical "production" version, creating a versioned snapshot that represents the official state of the engine. The finalization process locks all current AI signal adjustments and stores them alongside baseline GRS values for each country. Admins can also reset all data to baseline at any time, clearing all AI signals, GRS-Live snapshots, and forecasts to return to the static Layer 1-7 model output. All admin actions are recorded in an audit log with timestamps, user attribution, and affected record counts. The Data Management panel is accessible from the Intelligence page (admin only) and supports selective clearing of specific data categories (signals, events, forecasts, annotations, snapshots) without requiring a full reset.
DeGroot Convergence History & Timeline
The ARGOS platform stores historical DeGroot Consensus convergence snapshots in the database after each OSINT ingestion cycle. These snapshots capture the full convergence trajectory for each country: initial scattered event positions, intermediate averaging iterations, and the final consensus point. The DeGroot Convergence widget on the Intelligence page features an interactive country selector that defaults to the highest-signal country (dynamically determined, not hardcoded) and supports adding/removing multiple countries as overlay chips for side-by-side convergence comparison. A dedicated timeline view allows analysts to replay historical convergence patterns, observing how signal fusion behavior evolves across ingestion cycles.
Geopolitical Event Timeline
Country risk profiles on the Dashboard now include a Geopolitical Event Timeline that overlays categorized OSINT events against the GRS-Live trajectory. Each event is plotted on a time axis with color-coded markers by sub-index (ISI, ETI, EVI, CEI, ACI, ENV, SCI), sized by magnitude, and annotated with source credibility indicators. Hovering over an event marker reveals a high-contrast tooltip with the headline, source, categorization details, and confidence score. The timeline supports filtering by sub-index and time range, and connects to the full Intelligence feed for deeper investigation.
Email Notification Integration
The platform integrates email notifications for administrative workflows. When an account request is approved or rejected by an admin, the applicant receives an automated email notification via the built-in notification system. Approval emails include a welcome message with login instructions, while rejection emails provide a brief explanation. This supplements the existing signal-threshold notifications and email digest system, ensuring that all stakeholder communications are handled through a unified channel.
Bulk CSV Import & Export (Admin)
The Admin GRS Data panel supports bulk operations via CSV files. Admins can upload a CSV file containing variable changes for multiple countries, which are validated, previewed, and applied in a single batch operation. The import validates column headers, data types, and value ranges before committing changes. Conversely, the override history can be exported as a CSV or formatted PDF report for audit purposes, capturing all variable changes with before/after values, timestamps, and admin attribution.
Export & Reporting
Multiple export options are available across the platform:
- Intelligence Brief (PDF) (Intelligence page): Multi-page formatted report including executive summary with event statistics, AI signal summary table for all monitored nations, categorized OSINT event feed with source links, country-specific risk profile (when filtered), and full methodology notes. Generated via print dialog for browser-native PDF saving.
- Events CSV Export (Intelligence page): Downloads all filtered OSINT events as a CSV spreadsheet with date, country, sub-index, magnitude, confidence, headline, source, and URL columns.
- One-Page Brief (PDF) (Dashboard): Boardroom-ready single-page country risk summary with GRS gauge, sub-index bars, key variables, and regional comparison.
- Full Briefing (PDF) (Dashboard): Multi-page country risk assessment with all sub-index analysis, variable data tables, and regional peer comparison.
- CSV Export (Variable Explorer, Dashboard): Downloads variable breakdowns, GRS register, or full dataset for offline analysis.
- Print / PDF (Wiki, Variable Explorer): Browser-native print function optimized with custom print CSS for clean PDF generation. All expandable sections auto-expand, dark formula cards invert for readability, and navigation elements are hidden.
- Equation Cascade PDF (About / Methodology): Professional printable document showing all 37 ARGOS equations (22 statistical models + 7 sub-index aggregations + 8 AI calculations) with KaTeX-rendered mathematical notation, parameter tables (symbol, parameter name, resolved value), computed results, and detailed narration summaries for any selected country. Includes executive summary, sub-index profile, GRS master formula with numeric substitution, and pipeline layers overview. Supports single-country and two-country comparison modes.
- AI Signal Layer PDF (About / Methodology): Dark-themed printable document covering the complete 8-stage OSINT-to-GRS-Live pipeline with KaTeX equations, OSINT headlines table with source badges and sub-index tags, sub-index signal distribution, stage-by-stage analysis with narration summaries, and GRS-Baseline to GRS-Live transition. Maintains the Neural Feed dark aesthetic in print.
10. Modifications 1-4 (V4 Engine)
Four algorithmic modifications introduced in ARGOS V4 to address false-negative cases where the baseline GRS underestimates risk. These modifications do not alter the core GRS formula but add supplementary alert layers that flag latent vulnerabilities invisible to the composite score alone.
Modification 1: Threshold Proximity Band
Nations with GRS between 28 and 30 are classified as "Borderline Elevated," a watch-list tier indicating proximity to the Elevated threshold (30) without triggering full reclassification.
if (GRS ≥ 28 && GRS < 30) → "Borderline Elevated"
Rationale: Addresses cases like Kazakhstan (GRS=26.3) and Nepal (GRS=28.8) that sit just below the threshold but exhibit crisis-level stress in specific dimensions.
Modification 2: Sub-Index Alert System
Any individual sub-index exceeding 35 triggers a dimension-specific elevated risk flag. This catches cases where overall GRS is moderate but a single dimension is critically stressed.
if (SubIndex_i ≥ 50) → severity: "critical"
if (SubIndex_i ≥ 35) → severity: "warning"
if (ACI < 30) → severity: "warning" (inverted: low ACI = weak resilience)
Modification 3: Financial Stress Sub-Indicator
A composite Financial Stress Score (FSS) computed from real-time BIS and IMF data. Provides early warning for financial crises that the static EVI may miss.
FSS = 0.40 × CreditGapStress + 0.35 × DebtStress + 0.25 × DeficitStress
Sources: BIS Credit-to-GDP Gap (stats.bis.org, WS_CREDIT_GAP 1.0, Q3 2025), IMF WEO (April 2025 actuals)
Coverage: 87 ARGOS nations (42 with BIS credit gap data)
Threshold: FSS ≥ 35 = Financial Stress Alert
Modification 4: Velocity Detector
Detects rapid GRS deterioration: a change exceeding 5 points over a 2-year window triggers a trajectory alert, indicating imminent threshold breach even if current GRS is below threshold.
if (GRS_2024 - GRS_2022 > 5) → "Rapid Deterioration"
Source: ARGOS Historical GRS back-calculation (World Bank indicators, 2005-2024)
Implementation: All four modifications are active in the Alert Badge Panel displayed on the country detail view. See argos-modifications.ts for the full implementation. Documented in Chapter 13 (Section 13.3) of the manuscript.
11. Formal Verification
The mathematical properties of the ARGOS framework have been formally verified using the Lean 4 theorem prover via the AXLE (Axiom Lean Engine) platform. This provides machine-checked, independently reproducible proof that the algorithm's structural claims are logically sound.
Verification Summary
17/17
Theorems Verified
0
Failed Declarations
0/17
Counterexamples Found
What Was Proven
- ✓Weight Normalization: Both the layered composite weights (λ₁–λ₅ = 1.0) and GRS-z component weights (α_H + α_C + α_V + α_D = 1.0) sum to exactly unity.
- ✓GRS Boundedness: The GRS-Baseline is bounded to [-15, +85] and the full layered GRS to [-8.25, +93.25] given sub-index ranges.
- ✓GRS-z Unit Interval: The Geopolitical Redshift Index is bounded to [0, 1] for all valid inputs.
- ✓Monotonicity: Increasing ISI, ETI, ENV, or SCI increases GRS (risk-additive); increasing ACI decreases GRS (resilience-protective). Theorems 5a-5e.
- ✓Tier Partition Completeness: The five risk tiers (Low, Moderate, Elevated, High, Critical) form a complete, non-overlapping partition of all real numbers.
- ✓Phase Threshold Ordering: GRS-z thresholds are strictly ordered (0 < 0.30 < 0.50 < 0.70 ≤ 1.0).
Attestation Evidence
AXLE Check Tool (okay: TRUE)
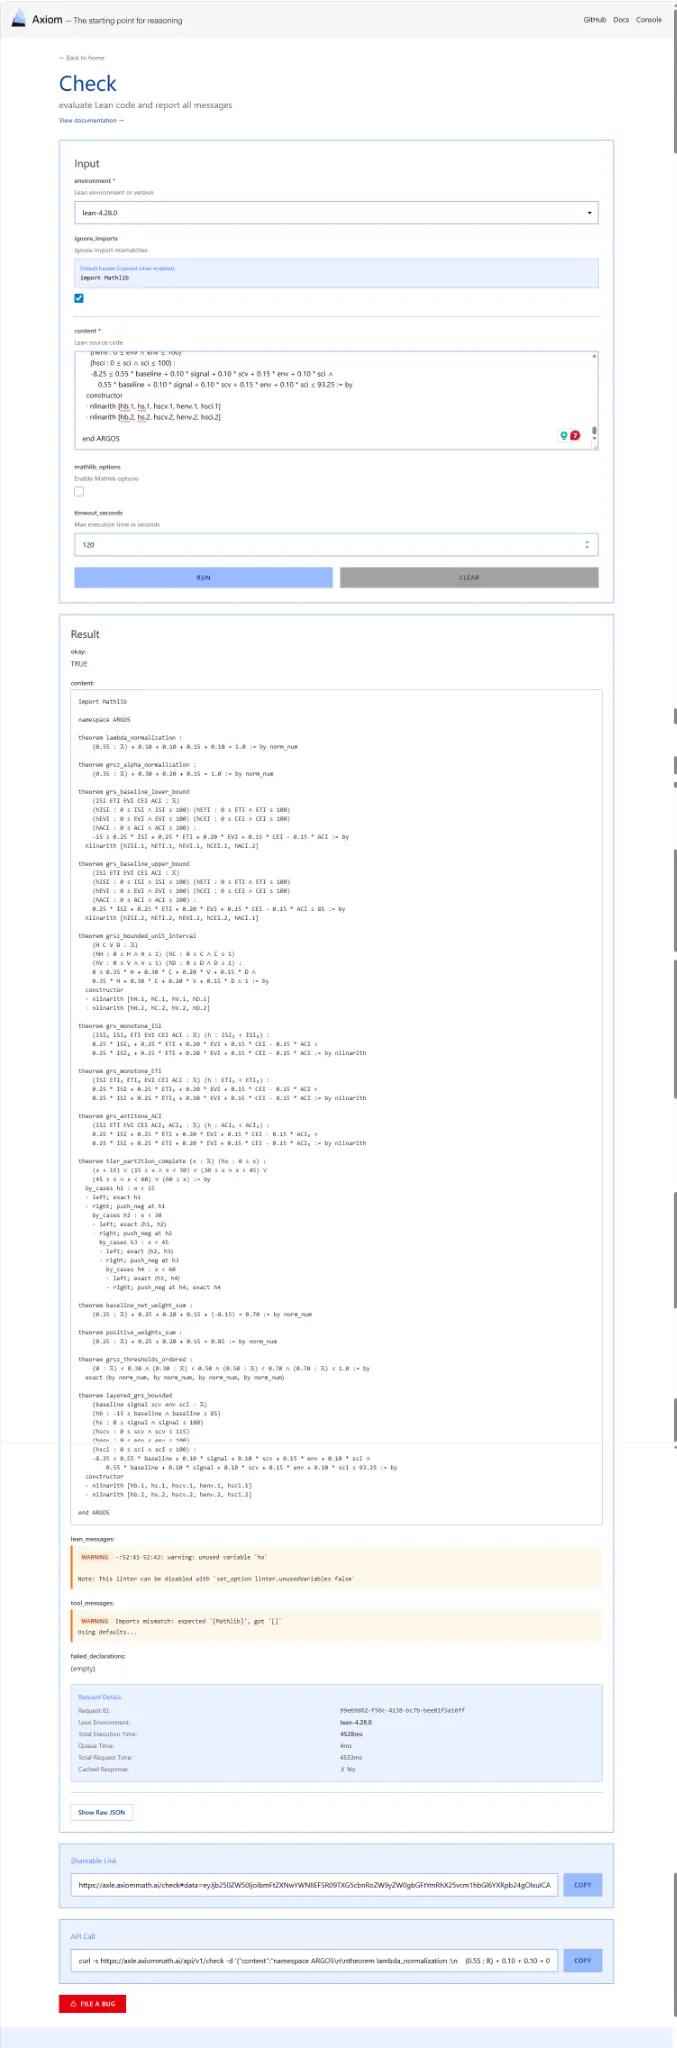
Request ID: 99e69d62-f7c6-4230-ac79-bee93f5ac6ff
AXLE Disprove Tool (0 counterexamples)
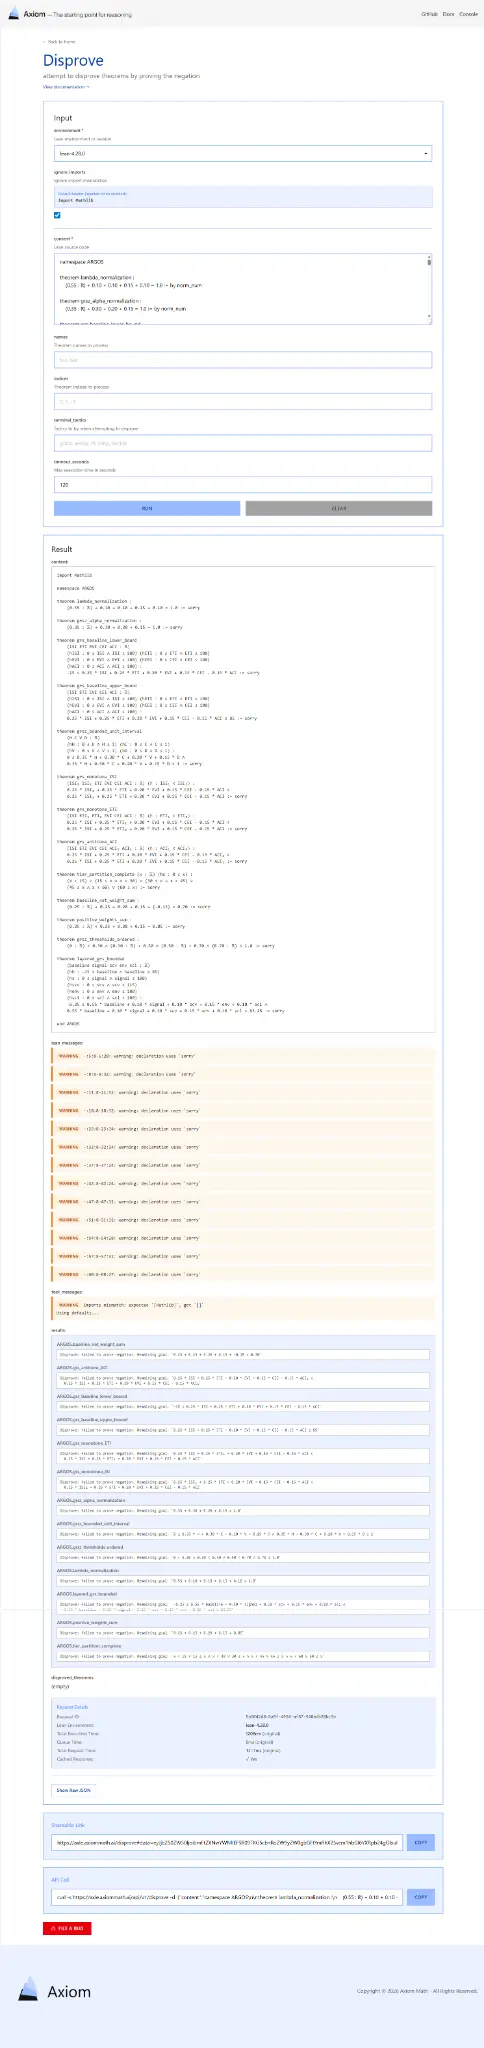
Request ID: 5a68d2d8-8a9f-4954-af87-540adb28bc5b
Full details: See the dedicated Formal Verification page for all 17 theorem statements, complete Lean 4 proofs, and reproducibility instructions. Documented in Appendix G of the manuscript.
12. Glossary
Key terms, abbreviations, and technical concepts used throughout the ARGOS framework.
ARGOS Documentation - The Calculus of Nations
Adaptive Real-time Geopolitical Operating System
Generated May 16, 2026